🧮 The CPU
How a modern processor really executes your code: the ISA, the pipeline, out-of-order and speculative execution, SIMD, interrupts, and how C becomes assembly.
2.1 The processor under your code
The C abstract machine lets you reason about expressions, objects, and side effects. The ISA turns that into a sharper contract: instructions, registers, addressing modes, exceptions, and memory-ordering rules that software is allowed to depend on. On an AMD64 machine, for example, your code sees rax, rip, cmp, jmp, page faults, and a defined instruction stream. It does not see reorder buffers, branch predictors, cache-fill buffers, store queues, or the particular layout of an AMD Zen, Intel Core, or Arm Neoverse core.
That separation is deliberate. The architectural model is simple enough to program against: fetch the next instruction, execute it, update architectural state, repeat. A debugger, signal handler, kernel exception path, and disassembler all mostly speak this language. But the silicon under that model is not a tiny clerk executing one line at a time. A modern high-performance core is a parallel machine: it overlaps work in a pipeline, issues multiple operations per cycle when dependencies allow, executes many operations out of their original order, guesses future control flow, and pulls data through a hierarchy of private caches, shared caches, and DRAM.
The trick is that the core must usually retire instructions in program order, so the visible architectural state looks as if the simple sequential story happened. Wrong-path speculative work is discarded. Early independent work is held back until older instructions are known to be safe. This illusion is powerful, but it is not free, and C programmers who write hot paths eventually run into the bill.
A register-to-register integer operation can complete in well under 1 ns; a dependent trip to DRAM after a last-level-cache miss is commonly on the order of 100 ns, which is hundreds of cycles on a multi-GHz core. A hard-to-predict branch can waste roughly tens of cycles on modern deep pipelines; measurements around Zen 2 put a misprediction penalty near 16.5 cycles for a tight benchmark. These are not constants of the ISA. They are properties of the implementation, workload, clock, memory system, and surrounding contention.
For ordinary code, the compiler and hardware hide much of this. For driver, kernel, NIC datapath, and kernel-bypass code, hiding is not enough. A receive loop that touches a cold descriptor ring, branches unpredictably on packet metadata, or serializes on a shared cache line may still be functionally correct C and perfectly valid assembly, yet miss the packet-rate budget. The processor under your code is therefore both a contract and a machine: the ISA defines what must happen; the microarchitecture determines how fast, how predictably, and under which access patterns it actually does.
Sources
2.2 ISA vs microarchitecture
An instruction set architecture, or ISA, is the contract between software and the processor. It says which instructions exist, what registers and flags they read and write, how addresses are formed, how exceptions are reported, and what the visible result of each instruction must be. It does not say how many adders the chip has or how instructions are scheduled internally. Those are implementation choices.
This is why one Linux x86-64 binary can run on many generations of AMD and Intel CPUs. The binary targets the contract usually called x86-64 or AMD64; Intel documentation calls its compatible implementation Intel 64. A program built for the Arm A-profile AArch64 execution state is often described by operating systems and toolchains as arm64 or ARM64. The ISA is the stable surface the compiler, assembler, linker, debugger, kernel, and user program agree on.
The most visible architectural state is the register file. Registers are the named storage locations instructions can operate on directly. They are not memory, and they are not cache; they are part of the programmer-visible CPU state.
In x86-64, the integer general-purpose register set has sixteen 64-bit registers: RAX, RBX, RCX, RDX, RSI, RDI, RBP, RSP, and R8 through R15. Many have smaller names for their low parts, such as EAX for the low 32 bits of RAX, AX for the low 16, and AL for the low 8.
In AArch64, the integer register set has thirty-one 64-bit registers named x0 through x30; their low 32 bits are named w0 through w30. There is also a zero register, xzr or wzr, which reads as zero and discards writes, and a stack pointer, sp. The encoding value that looks like register 31 means either the zero register or stack pointer, depending on the instruction. x30 is commonly used as the link register.
The architectural register file is not the whole physical story. Modern cores usually have many more physical registers than the ISA exposes, so they can keep independent internal versions of architectural registers while executing aggressively. That mechanism belongs later; for now, RAX or x0 is the name software sees.
The old labels CISC and RISC describe different ISA design instincts. A CISC ISA, "complex instruction set computer", tends to have variable-length encodings and instructions that can combine a memory access and arithmetic. x86-64 is the canonical modern CISC survivor: instruction lengths vary from 1 to 15 bytes, and add rax, [rbx] both loads from memory and adds to RAX.
A RISC ISA, "reduced instruction set computer", tends to use simpler, more regular instructions and fixed-length encodings. AArch64 is RISC in this broad sense: ordinary A64 instructions are 32 bits wide, and arithmetic generally operates on registers rather than arbitrary memory operands.
The modern twist is that these labels describe the external ISA more than the internal machine. High-performance x86-64 cores are often RISC-like inside: the front end decodes variable-length x86 instructions into smaller internal operations called micro-ops, or uops.
// x86-64 source instruction:
//   add rax, [rbx]
// typical internal split on many cores:
//   uop: load from address in RBX
//   uop: add loaded value to RAX
The exact uop breakdown is microarchitecture-specific. Some instructions decode to one uop; some to several; very complex instructions may use microcode assistance. Modern x86 cores also avoid repeated full decode when they can. Intel and AMD cores have used decoded-instruction or uop caches so hot instruction streams can be supplied as already-decoded internal operations. Many cores also support fusion: for example, a compare or test followed by a conditional branch may be treated as a fused operation. These are performance features, not ISA guarantees.
The microarchitecture is the implementation of the contract: the decoders, uop cache, execution units, ports, load/store machinery, caches, TLBs, predictors, prefetchers, and policies that decide how quickly work gets done. An AMD Zen core and an Intel Core-family core can both execute the same x86-64 stream correctly while having different decode widths, cache hierarchies, execution-port layouts, latency and throughput numbers, and performance counter events. Two Arm cores can both implement AArch64 while making different choices about issue width, cache size, and memory behavior.
For low-level C and driver work, this split prevents muddled reasoning. The ISA tells you what a binary or kernel module may depend on: register names, instruction semantics, privilege transitions, atomic instructions, and the ABI layered on top. The microarchitecture explains why the same correct code has different throughput or tail latency on different chips. A hot packet-processing loop cares that AArch64 has more architectural integer registers than x86-64, because more packet pointers, lengths, masks, and counters may stay in registers instead of being spilled. Correctness starts at the ISA boundary; performance starts when you ask how this particular core implements it.
Sources
2.3 The instruction execution cycle
At the machine level, a processor repeats a simple loop: choose the next instruction, understand what it says, do the work it names, and make the result part of the machine state. The ISA tells software what this loop must appear to do. The microarchitecture decides how the loop is actually built.
for (;;) {
    instruction = fetch(PC);
    PC = next_PC(PC, instruction);
    execute(decoded(instruction));
}
That pseudocode hides almost everything interesting, but it captures the first principle. A distinguished architectural location identifies where instruction fetching comes from. In many ISAs it is the program counter, or PC; in x86-64 it is the instruction pointer RIP. In the ordinary fall-through case, fetching also advances toward the following instruction: by 4 bytes for fixed-width 32-bit MIPS instructions, by the current instruction length on variable-length x86, and by the architecture's rules on Arm. Branches, calls, returns, traps, and exceptions replace that normal next address.
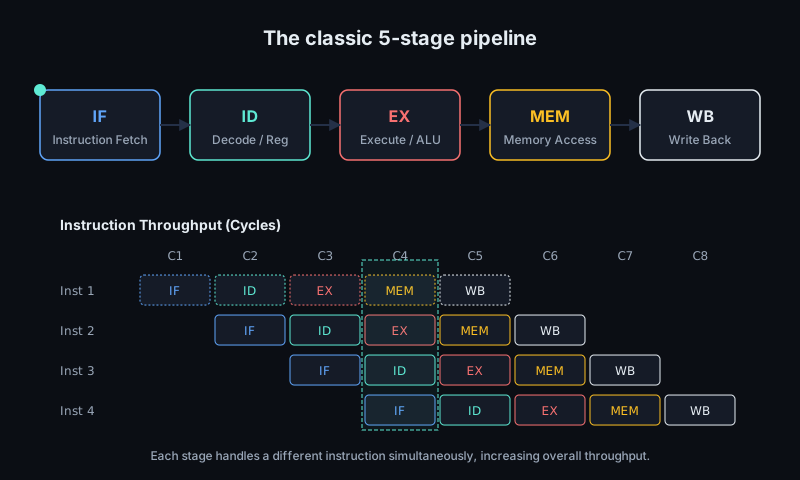
The classic teaching model is the MIPS-style five-stage RISC pipeline: Instruction Fetch (IF), Instruction Decode/register read (ID), Execute/ALU (EX), Memory access (MEM), and Write-back (WB). Treat these first as a clean lifecycle for one instruction. Modern x86 and Arm cores have many more internal stages and may split, fuse, reorder, and speculate around this model, but the five names remain useful.
Instruction Fetch (`IF`) asks: which instruction bytes or words should enter the core next? The core presents the PC to the instruction side of the memory hierarchy, usually hitting in an instruction cache in a hot loop. For lw r1, 0(r2), fetch obtains the 32-bit MIPS instruction word at the current PC; in the sequential case, the next fetch address is PC + 4. For x86, fetch obtains bytes beginning at RIP, and decode determines the next RIP.
Instruction Decode/register read (`ID`) asks: what operation is this, and which architectural operands does it name? For lw r1, 0(r2), decode identifies a load, destination register r1, base register r2, and displacement 0; the register file is read to obtain r2. For add r3, r1, r4, decode identifies an integer add and reads r1 and r4. Decode is where instruction bits become control signals and operand identifiers.
Execute (`EX`) asks: what value or address must be computed? For add r3, r1, r4, the ALU adds the two source operands. For lw r1, 0(r2), the ALU adds the base value and displacement to form an effective address. For a compare or branch, execute may compute a condition or target. Execute is not necessarily where architectural state changes; it is where the computation is performed.
Memory access (`MEM`) asks: does this instruction need the data side of memory? Arithmetic instructions such as add normally pass through without a data access. A load uses the effective address from EX to read data. A store uses the effective address and store data to write. For driver work, this is where the model connects to devices: an MMIO load or store is still an instruction flowing through the core, but the address maps to a device register rather than cacheable RAM. The access may become a transaction toward a NIC, PCIe device, or interconnect, subject to rules covered later.
Write-back (`WB`) asks: what architectural destination, if any, receives the result? The add r3, r1, r4 writes its sum to r3. The lw r1, 0(r2) writes the loaded value to r1. A store usually has no register write-back, because its architectural effect is the memory write. In the simple in-order teaching pipeline, write-back is the visible completion point for register-producing instructions.
This is where terminology matters. Execute means a functional unit has carried out the operation: an address calculated, an addition performed, a condition evaluated, a load requested. Retire, or architectural commit, means the instruction's effects are accepted into architectural state. On simple in-order machines, write-back and completion are close. On real out-of-order x86 and Arm cores, the distinction is central: instructions may execute internally before older instructions have finished, but retirement occurs in program order so architectural state changes as if the program ran one instruction at a time.
That rule is why retirement counts are useful performance events: they count work that made it through the architectural machine, not speculative work later discarded. It is also part of reasoning about devices. When a driver stores to a NIC doorbell register, the source line becomes an instruction; that instruction is fetched, decoded, executed, and eventually retired. Exactly when the device-visible transaction reaches the NIC depends on memory ordering, cacheability, interconnect, and device rules, but retirement gives the CPU-side anchor.
For hot paths, the model gives a useful accounting habit. Each C statement becomes some number of instructions. Each instruction must be fetched, decoded, executed, and retired, and some also consume memory-system or device-system resources. A fast packet path keeps the stream of useful retired instructions small, predictable, and friendly to the core and memory hierarchy. The next step is to let multiple instructions occupy different stages at once.
Sources
2.4 Pipelining and hazards
Pipelining raises throughput by overlapping work. In the five-stage model, one instruction can be in IF while older instructions are in ID, EX, MEM, and WB. The latency of one instruction has not vanished; it still takes several stages. What changes is the completion rate once the pipe is full. A non-pipelined design might spend five cycle-times per instruction. An ideal five-stage pipeline can complete roughly one instruction per cycle, because each stage works on a different instruction.
The word ideal matters. A pipeline is only faster when the next instruction can safely advance on the next cycle. A hazard is a condition where that advance would either produce the wrong answer or require unavailable hardware. The classic classes are structural, data, and control hazards.
Structural hazards are resource conflicts. If instruction fetch and data load need the same single memory port in the same cycle, one must wait. If two stages need one integer unit at once, one must wait. Textbook RISC pipelines often avoid common cases with separate instruction and data caches, enough register-file ports, and fixed functional units. Overlap exposes resource conflicts sequential execution would have hidden.
Data hazards occur when an instruction depends on a value whose producer is still in the pipeline. The key case for this in-order model is read-after-write, or RAW, also called a true dependence:
add r1, r2, r3
sub r4, r1, r5
The sub needs r1, but the add will not write r1 to the register file until later. If sub reads during ID, it may see the old value. Waiting until WB would be correct but slow, because the add result is usually available earlier, at the end of EX.
Forwarding, or bypassing, sends a just-produced value directly from a later pipeline stage to a consumer, without waiting for architectural register writeback. Here, the add result can be forwarded from the EX output into the following sub input. Architecturally, it still looks as if r1 was written and then read in program order. Physically, the value took a shorter path.
Forwarding cannot solve every RAW hazard. The classic remaining case is load-use:
load r1, [r2]
add  r3, r1, r4
The load's EX stage computes the address; the data returns later, during MEM. The following add needs operands at the start of its own EX stage. Without delay, the value would be needed before it exists. Even with forwarding from MEM to EX, a simple five-stage pipeline inserts a one-cycle stall for this pair.
A stall holds one or more stages in place until the hazard clears. The empty slot created behind the stalled instruction is a bubble: a cycle in which some stage carries no useful instruction, much like an inserted nop. Bubbles preserve correctness by reducing overlap. Their cost is throughput. A loop with a load immediately followed by a dependent use can run slower than its instruction count suggests, even on cache hits.
The other data-hazard names are write-after-read and write-after-write, WAR and WAW. In this simple in-order pipeline they are usually not the limiting cases: reads happen in order before later writes, and writes happen in order at the end. They matter more once implementations allow flexible timing, which is where the next part of the chapter goes.
Control hazards come from changing the program counter. After a conditional branch is fetched, the pipeline may not yet know which instruction should be fetched next. If it waits for the branch to resolve, fetch goes idle. If it fetches down one path and that path is wrong, the younger instructions from the wrong path must be discarded.
Discarding them is a pipeline flush. A flush costs more than a single bubble because several partially processed instructions may already occupy the pipe. Their work is thrown away, fetch restarts at the correct address, and the pipe must refill before completions resume. In the five-stage teaching pipeline, a branch resolved in EX can squash the younger instructions in earlier stages. In modern x86 cores the internal pipeline is deeper and the front end is more complex; branch-misprediction penalties are commonly on the order of 15 to 20 cycles. AMD's Family 19h guide gives roughly 11 to 18 cycles depending on branch type and front-end state, and Agner Fog reports similar ranges across recent Zen cores. The exact number is microarchitecture-specific, but the lesson is that a wrong control-flow decision wastes many cycles of overlapped work.
This is why hot low-level C is sensitive to shape. Long dependent chains limit overlap. Load-use pairs, especially pointer chasing, create waiting even on cache hits. Branchy parsing or dispatch can be fast when branches are predictable, but frequent wrong-way control flow turns front-end bandwidth into flushed work. Real cores go far beyond this simple in-order pipeline, but the basic accounting remains: overlap raises throughput; hazards are where overlap must pause, route around a value, or be thrown away.
Sources
2.5 Superscalar, out-of-order execution
Once a pipeline can accept a new instruction every cycle, why stop at one. A superscalar core is wider than a scalar pipeline: it tries to fetch, decode, issue, execute, and retire more than one instruction per cycle. This is the core's attempt to exceed IPC = 1, where IPC means retired instructions per cycle.
Real high-performance cores are several instructions wide. Intel's Golden Cove can allocate 6 micro-ops per cycle, has 12 execution ports, can retire up to 8 micro-ops per cycle, and can decode up to 6 instructions per cycle. Arm's Cortex-A76 is a 4-wide decode out-of-order superscalar design with a 128-entry out-of-order window. These numbers describe the width of the machine the instruction stream is trying to keep fed.
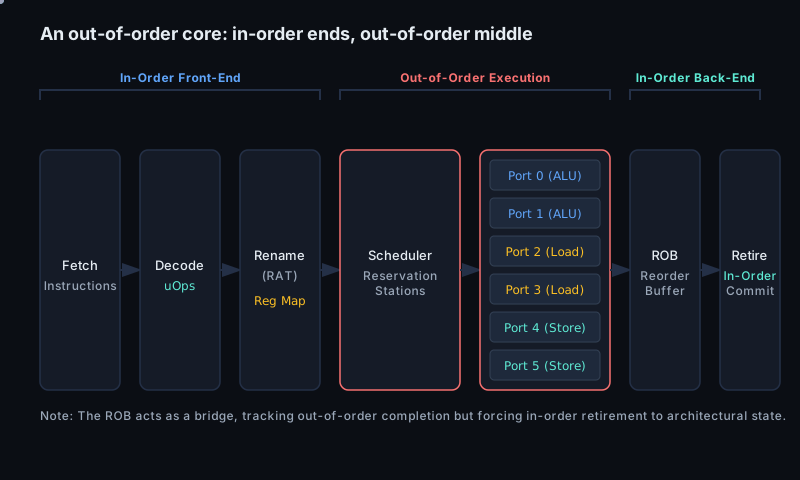
Wide machines need more than simple in-order issue because program order is often a poor order for using the hardware. If an older instruction waits for a cache miss, a division, or a long-latency multiply, an in-order core may stop behind it even though later instructions are independent. An out-of-order core separates defined program order from execution order. Instructions enter in program order, but execute when their operands are ready and a suitable execution unit is free.
That requires the core to know which dependencies are real. A read-after-write dependency is real: if d = a + e follows a = b + c, the second operation needs the first result. But architectural register names also create false dependencies. A compiler may reuse rax or x0 for unrelated values. If the hardware treated that name as the actual storage location, independent writes and reads would appear ordered even when no value flows between them.
Register renaming removes those false dependencies. The ISA exposes architectural registers; the microarchitecture has a larger physical register file. During rename, each architectural destination is mapped to a fresh physical register, and each source is tagged with the physical producer it actually needs. False write-after-write and write-after-read dependencies disappear because unrelated uses of the same architectural name are placed in different physical registers. True read-after-write dependencies remain. This idea traces to Tomasulo's 1967 IBM System/360 Model 91 algorithm, which used register tags, reservation stations, and a common data bus.
Modern cores scale the same principle. Agner Fog reports AMD Zen 4 with 224 integer physical registers and a 320 micro-op reorder buffer, and Zen 5 with 240 integer physical registers. There are more physical destinations than architectural register names, so many renamed versions of "the same" register can coexist.
After decode and rename, a micro-op that cannot execute immediately waits in a reservation station or scheduler queue. It carries tags for its source operands. When a producer finishes, dependent micro-ops become ready. The scheduler chooses ready micro-ops and dispatches them to compatible execution ports: integer ALUs, address-generation units, load/store units, branch units, and floating-point units. Ports make parallel execution physically possible; scheduling finds ready work to use them.
This is not unbounded optimization. The core has a finite instruction window. It can find instruction-level parallelism, or ILP, only among instructions already fetched, decoded, renamed, and admitted into its queues. ROB entries, scheduler entries, load/store queues, and physical registers all bound that window. A packet-processing loop that pointer-chases through descriptors may expose little ILP because each load address depends on a previous load result. Batching several packets may expose independent work from different packets.
The missing correctness mechanism is the reorder buffer, usually shortened to ROB. The ROB tracks in-flight instructions in program order. Execution units may finish out of order and write results into physical registers or store buffers, but completion is not architectural commitment. At the head of the ROB, the core retires or commits instructions in order. Only the oldest completed instruction may update architectural state.
In-order retirement is what lets an out-of-order machine behave like the sequential ISA model expected by correct C and assembly. It gives exceptions and interrupts a precise boundary: all older instructions have retired, and no younger instruction has. Wrong-path work from a mispredicted branch is discarded before retirement; the next section explains that machinery.
For low-level driver and NIC work, the distinction matters. The ROB preserves in-order architectural state for one thread, but devices and other cores do not simply observe your source-code order for all memory operations. MMIO, DMA rings, and inter-core communication therefore need the ordering tools covered later: compiler barriers, volatile where appropriate for device registers, and architectural memory fences.
The compact model is: rename removes false register dependencies, reservation stations wait for true operands, execution ports run ready work in parallel, and the ROB makes committed results appear in order. Performance comes from how much independent work the core can see before its finite window fills. With many independent operations, a wide out-of-order core can retire several useful instructions per cycle. With one long dependency chain, most of that machinery waits.
Sources
2.6 Branch prediction and speculation
An ordinary instruction stream is linear: fetch the next bytes, decode them, issue the resulting operations, and keep the machine full. A branch breaks that line. Until the processor knows whether a conditional branch is taken, or where an indirect branch goes, the front end does not know which instruction bytes to fetch next. Waiting would waste a deep, wide core, so the processor guesses.
There are several problems behind the word branch. A conditional branch has a direction, taken or not taken, and a target if taken. A direct branch or direct call has a target encoded in the instruction, so the main problem is recognizing it early. An indirect branch or indirect call gets its target from a register or memory value, so the target itself must be predicted. A return is also indirect, but calls and returns usually nest, so processors predict returns with a small Return Address Stack, or RAS: calls push the likely return address, returns pop it.
Direction prediction starts from bias. Loop back-edges are usually taken until the final iteration; error checks are usually not taken; state-machine branches often stay stable for long runs. A one-bit predictor remembers only the last outcome, but flips too easily. The classic improvement is a 2-bit saturating counter: strongly-not-taken, weakly-not-taken, weakly-taken, strongly-taken. One surprising result weakens the opinion; two are needed to reverse a strong opinion. That is why a normal counted loop is usually mispredicted at exit, not on every trip.
Modern predictors also use history. Some branches correlate with earlier branches: if one parse decision went a certain way, a later test may become likely. Two-level predictors keep local or global branch history and use it to index tables of counters. TAGE-family predictors extend this with multiple tagged tables indexed by histories of different lengths. Short histories capture local patterns; long histories capture distant correlation; tags reduce accidental sharing between unrelated branches.
Target prediction answers "where next?" A Branch Target Buffer, or BTB, is a cache indexed by the address of recently seen branch instructions. It records predicted destinations and branch metadata so fetch can redirect before the target has been recomputed. Direct branches are comparatively easy. Indirect branches are harder because one instruction may jump to many places: function pointers, virtual calls, jump tables, and interpreter dispatch all have this shape. Returns are easier when the RAS remains correctly nested, but unusual control flow can still confuse it.
Speculation is what makes prediction pay. Once the front end has a predicted path, the core fetches, decodes, issues, and executes instructions from that path before the branch is proven correct. Architecturally, the machine must still look sequential. If the prediction was right, speculative work becomes ordinary work. If it was wrong, younger wrong-path work is squashed before it becomes committed program state, and fetch restarts at the correct address.
The cost is lost work plus recovery time. On modern x86 cores, branch-misprediction recovery is commonly a rough 15 to 20 cycles, depending on microarchitecture and branch type. In a wide machine, that is more than a latency; it is a hole where several useful operations per cycle might otherwise have retired.
This is why branch behavior matters in driver and packet hot paths. A predictable "fast path versus rare error path" branch is usually fine. A data-dependent branch on traffic-shaped fields can be close to random, which is the predictor's worst case. Fast paths therefore often separate rare cases out of line, use compact classification tables, prefer masks or conditional moves for tiny choices, and batch work so the branch history sees longer runs of similar cases.
if (len >= 64)
    good++;
else
    short_pkt++;
There is nothing inherently wrong with this code. The question is whether len >= 64 is predictable in the real workload. If it alternates unpredictably, the branch can dominate a loop whose useful work is otherwise tiny.
The security lesson was that "squashed before commit" was not the same as "never happened." Wrong-path instructions can change microarchitectural state, especially cache state, and later timing measurements can observe those traces. Spectre Variant 1, CVE-2017-5753, abuses mistrained conditional branches such as bounds checks, causing victim code to transiently read data and encode it into cache state. Spectre Variant 2, CVE-2017-5715, poisons indirect branch target prediction so speculation jumps to a useful victim-side gadget. Meltdown, CVE-2017-5754, is different: on affected CPUs, faulting loads could transiently use privileged data before the fault became architectural, again leaking through cache timing.
The mitigations follow the mechanism. Retpoline rewrites indirect branches so speculation is trapped in a harmless return-based sequence instead of following a poisoned BTB prediction; newer CPUs also provide hardware controls such as IBRS-family features. KPTI/PTI reduces Meltdown exposure by keeping most kernel mappings out of user page tables. Bounds-check hardening, speculation barriers, careful masking, and avoiding secret-dependent transient accesses all exist because speculation made prediction a security concern as well as a performance feature.
Sources
2.7 SIMD and data parallelism
SIMD means single instruction, multiple data: one instruction applies the same operation to a vector of lanes. Instead of adding one float to one float, a SIMD add might add four, eight, or sixteen pairs of float values in parallel. The program still issues an instruction stream, but some instructions name vector registers and operate lane-wise over packed elements.
This exists for a different reason from the instruction-level parallelism discussed earlier. A superscalar core finds independent scalar instructions already present in the stream. SIMD lets the program expose a regular pattern directly: "do this same operation to many adjacent elements." That amortizes fetch and decode over more data and uses wide execution datapaths.
Physically, SIMD appears as wider architectural registers plus lane-wise instructions. On x86, Intel introduced SSE with 128-bit XMM registers in the Pentium III in 1999. AVX reached Intel Sandy Bridge and AMD Bulldozer systems in 2011 with 256-bit YMM registers; AVX2 followed with Intel Haswell in 2013 and broadened integer SIMD at that width. AVX-512 first shipped in Intel Xeon Phi x200 in 2016, adding 512-bit ZMM registers and mask registers for predicated operations. A 512-bit ZMM register can hold sixteen 32-bit floats or eight 64-bit doubles. The low 128 bits of a YMM register are its corresponding XMM register; the low 256 bits of a ZMM register are its corresponding YMM register.
Arm has a different style. NEON, also called Advanced SIMD, provides fixed-width SIMD over 64- and 128-bit vector registers; on AArch64 the SIMD/floating-point register file is commonly used as thirty-two 128-bit V registers. NEON code therefore tends to bake in a fixed width: four float32 lanes, two float64 lanes, sixteen bytes, and so on. Arm SVE, the AArch64 Scalable Vector Extension, changes the model. An implementation chooses a vector length from 128 to 2048 bits in 128-bit increments, while well-written SVE code is vector-length agnostic: it loops using predicates and "how many lanes are active now?" operations rather than constants such as "process exactly eight elements." SVE2 extends the idea with more integer, bit-manipulation, and DSP-like operations. Predication handles tails and conditional work without a scalar cleanup branch for every awkward length.
In C, there are three practical routes to SIMD. The first is auto-vectorization: write a clean counted loop over arrays, compile with -O2 or -O3, and enable the target ISA with -march=native when acceptable. This is portable, but fragile: the compiler must prove the transformation is legal and profitable. Unknown pointer aliasing, loop-carried dependencies, branches, and reductions can all block vectorization. restrict tells the compiler that pointers do not overlap, and #pragma omp simd can assert SIMD intent.
for (size_t i = 0; i < n; i++)
    dst[i] = a[i] * scale + b[i];
That loop is the kind compilers like: linear induction variable, contiguous arrays, one operation pattern, no early exits. Alignment also matters. Modern ISAs usually have unaligned vector loads and stores, but aligned data can still avoid penalties and helps compilers choose simple code. More important is regularity: contiguous memory, predictable trip counts, and little control flow.
The second route is intrinsics. On x86, intrinsics are normally reached through <immintrin.h>; on Arm NEON, through <arm_neon.h>; SVE uses Arm C Language Extensions intrinsics. Intrinsics look like C functions, but map closely to ISA operations and vector types. They are useful when you need a specific instruction, data layout, or guarantee the compiler will not miss a transformation. The cost is portability: AVX2 is not NEON, and SVE is not SSE. You also inherit lane order, mask behavior, widening and narrowing operations, and target-feature dispatch.
The third route is libraries or portable SIMD wrappers. Math, crypto, compression, memcpy, memset, and packet-processing frameworks often contain tuned back ends selected at build time or runtime. C++ projects may use abstraction layers that present a vector API and lower to SSE, AVX2, AVX-512, NEON, or SVE. This moves ISA-specific code into a smaller surface.
Data parallelism wins when the same operation is applied to many elements, data are contiguous, and the loop is branch-light and arithmetic-heavy enough to repay setup cost. It is natural in low-level networking work: checksum and CRC kernels, byte classification, packet-header parsing over batches, flow-key comparisons, copy/fill paths, and kernel-bypass fast paths that process bursts of descriptors or packets. Batching matters because a four-lane or sixteen-lane operation needs enough independent elements to fill its lanes.
The limits are just as real. Amdahl's law still applies: scalar setup, tails, rare cases, and synchronization bound total speedup. If the loop is already limited by memory bandwidth, wider arithmetic may mostly make the core wait for data faster. Irregular pointer chasing and data-dependent branches often defeat SIMD because lanes want to move together. Historically, some Intel cores also reduced frequency for heavy AVX2 or AVX-512 regions, especially wide power-hungry code, so the fastest local instruction sequence was not always the fastest whole-program choice. Treat SIMD as a way to express abundant regular parallel work, not as a magic suffix on every loop.
Sources
2.8 Interrupts, exceptions, and privilege
Normally a core advances through one instruction stream and continues at the next RIP or PC. Interrupts and exceptions are the architectural escape hatch: the processor stops ordinary control flow, saves enough state to return, and jumps to a handler chosen by the operating system and constrained by the architecture.
The first distinction is whether the event is caused by the instruction being executed. A synchronous exception is a consequence of the current instruction stream: a page fault from an untranslated virtual address, a divide error, an invalid opcode, or a debugger breakpoint. Software interrupts and system-call instructions are also synchronous transfers into privileged code, though modern kernels treat the fast system-call path separately.
Architectures further classify synchronous exceptions by where execution resumes. A fault is reported before the instruction is architecturally completed, so the saved instruction pointer refers to the faulting instruction and the handler may fix the condition and retry it. A trap is reported after the instruction completes, so return resumes at the following instruction; breakpoints and single-step debug events fit this model. An abort reports a severe condition for which precise restart is not expected.
An asynchronous interrupt is different. It is not caused by the instruction being executed. A timer tick, keyboard event, or network interface can arrive while user code is running, but the processor presents the interrupt at an instruction boundary where architectural state is coherent. Internally, the core may discard younger speculative work or drain part of the machine, but architecturally the interrupt happened between two instructions.
The CPU finds the handler through a vector. On x86-64, the vector is an 8-bit number indexing the Interrupt Descriptor Table, so there are 256 possible vectors, numbered 0 through 255. Vectors 0 through 31 are reserved for architecture-defined exceptions and related events; the rest are available for external and software-defined interrupts. The IDTR register holds the base address and limit of the current IDT. Each IDT entry is a gate descriptor naming a code-segment selector, a handler offset, gate attributes, and privilege information.
That table lookup is only the beginning. When an x86-64 interrupt or exception is delivered, the processor saves a return frame on a stack. For a transition to a more privileged level, the frame includes the old SS, old RSP, RFLAGS, CS, and RIP; some exceptions then push an error code. Without a privilege change, RFLAGS, CS, and RIP are still preserved. The processor may also switch stacks through the Task State Segment, including RSP0, or through an Interrupt Stack Table entry.
Privilege is not just a software convention. On x86, the Current Privilege Level is encoded in the low bits of CS, and the architecture defines rings 0 through 3. Commodity operating systems put the kernel in ring 0 and applications in ring 3; rings 1 and 2 are essentially unused by mainstream kernels. A user program cannot simply jump to ring 0 code or load privileged control registers. It enters through a controlled gate or fast system-call machinery. The CPU checks privilege rules, switches to the kernel stack when needed, changes CS and privilege level, and starts the handler.
Masking is part of the contract. On x86, the interrupt-enable flag IF in RFLAGS controls ordinary maskable external interrupts; cli clears it and sti sets it. An interrupt gate clears IF on entry, while a trap gate does not. Non-maskable interrupts are not blocked by IF.
Return is also architectural. On x86-64, iretq restores the saved control state and, when returning to less privileged code, restores the user stack and privilege level. On AArch64, the equivalent return is ERET. Arm uses Exception Levels rather than rings: EL0 for applications, EL1 for the usual kernel, EL2 for a hypervisor, and EL3 for secure monitor firmware. Arm uses vector-base registers such as VBAR_EL1, but its vector table is organized by exception source and type rather than as a flat x86-style vector array.
Modern system calls are worth separating from old software interrupts. x86 instructions such as syscall/sysret and sysenter/sysexit are special-cased user-to-kernel transitions. They still change privilege and save enough state for return, but they avoid some descriptor-table machinery of a full interrupt gate, which is why operating systems use them for hot paths like read, write, send, and recv.
For low-level systems work, this machinery is not background trivia. The timer interrupt lets a kernel preempt a running thread and schedule another one. A received packet eventually reaches software because a device event becomes an interrupt-like entry into privileged code, even though bus-level delivery belongs to later chapters. A page fault while touching a DMA'd buffer, or a system call that hands a socket buffer to the kernel, rides the same path: save state, enter privileged code, do controlled work, and return. Saving and restoring state, changing privilege, disturbing prediction and pipeline state, and touching kernel code and data can all add latency. High-performance networking techniques such as interrupt coalescing, polling, and kernel bypass exist largely because this transition is correct and general, but not free.
Sources
2.9 Clocks, power, and performance counters
The clock printed on a CPU box is not the clock your code necessarily runs at. A modern core is synchronous, but its frequency is a controlled variable. The OS asks for performance through a CPU frequency-scaling driver; hardware chooses among operating points, often called P-states, that combine frequency and voltage. On Linux this is exposed through CPUFreq drivers such as intel_pstate, amd_pstate, or acpi-cpufreq, with governors or energy-performance hints biasing toward throughput, latency, or power saving.
Voltage matters because of CMOS switching cost. A first-order dynamic-power model is P = alpha * C * V^2 * f: C is switched capacitance, alpha is activity, V is supply voltage, and f is frequency. Raising frequency usually also requires raising voltage to meet timing, so power rises faster than linearly. That power becomes heat, which must leave through the cooler and chassis. This is why "just run it at 5 GHz" is not a stable abstraction.
Turbo mechanisms exploit unused budget. Intel Turbo Boost and AMD Precision Boost raise frequency above base when the processor is inside its power, current, temperature, and reliability limits. Available boost depends on active cores, instruction mix, cooling, package temperature, motherboard limits, and recent history. A one-core integer loop may boost much higher than an all-core AVX workload; a packet path sharing a package with interrupts, kernel threads, or another busy process may see its frequency move while the code is unchanged.
TDP is not "the maximum instantaneous watts the chip can ever draw." It is a thermal design target for sustained operation at specified conditions. Real processors have short and long power windows. Intel's RAPL interface, Running Average Power Limit, exposes energy counters and power-limit controls for domains such as package and DRAM; AMD systems expose comparable controls through firmware and drivers. If a workload exceeds a limit, hardware may reduce frequency even though no instruction fault occurs.
This matters for low-latency systems because power management creates jitter. A NIC polling loop, interrupt handler, or userspace packet processor may be fast in average cycles yet slow in tail nanoseconds if the core wakes from idle, migrates, loses turbo budget, or shares a package power limit. Latency-sensitive benchmarking therefore commonly pins threads, isolates CPUs, warms the workload, fixes or constrains frequency policy, and records package temperature and power state. Those controls remove moving variables from the experiment.
The cost model has two units. Cycles are right for microarchitecture: an L1 hit, branch mispredict, dependency chain, or throughput limit is naturally described relative to core cycles. Nanoseconds are right for service behavior: packet inter-arrival time, wire latency, interrupt moderation, and tail latency budgets are real time. Conversion is simple only at fixed frequency: at 3.0 GHz, one cycle is about 0.333 ns; 300 cycles is about 100 ns. Under turbo or throttling, the same 300 cycles may consume different wall time.
Be careful with RDTSC. On modern x86 machines, Linux often reports constant_tsc and nonstop_tsc; architecturally this corresponds to an invariant time-stamp counter that ticks at a fixed reference rate independent of current core frequency and continues across normal power-management states. That is useful for elapsed-time measurement, but RDTSC is not a count of actual core cycles when DVFS or turbo is active. Treat it as a reference counter for short timing intervals, with the usual serialization concerns, and leave full timekeeping to the OS material.
Cycle-accurate counters live in the processor's Performance Monitoring Unit. The PMU has programmable counters for model-specific events and, on common Intel cores, fixed counters for retired instructions, unhalted core cycles, and reference cycles. Linux perf gives a practical interface:
perf listshows available events, including architectural names and model-specific PMU events.perf stat -e instructions,cpu-cycles,ref-cycles,branches,branch-misses ./progcounts events for one command.perf stat -a -C 2 -e cycles,instructions sleep 10measures system-wide activity on CPU2.perf record -e cycles:u -g ./progsamples user-space cycle events and records call stacks for later inspection withperf report.
The distinction between cpu-cycles and ref-cycles is central. cpu-cycles counts actual unhalted core cycles at the current core clock. ref-cycles counts unhalted cycles at a fixed reference frequency. If a core boosts above reference, cpu-cycles / ref-cycles can exceed 1; if it throttles below reference, it can fall below 1. For a tight benchmark, instructions / cpu-cycles gives IPC, while cpu-cycles / ref-cycles tells you whether the clock changed. For driver and networking work, collect both: a regression may be more instructions, worse locality, more branch misses, or the same code running under a lower clock.
Counters are measurements of hardware events, not moral truth. They can be multiplexed when too many events are requested, constrained by perf_event_paranoid, perturbed by interrupts and scheduling, and affected by skid in sampled profiles. Still, PMU counters let you separate "the CPU did more work" from "the CPU ran slower" from "the benchmark measured time with the wrong clock."
Sources
2.10 From C to assembly
Reading disassembly starts with a simple discipline: identify the function boundary, identify where inputs live, then follow data movement. On x86-64 System V, the first integer or pointer argument arrives in rdi; the return value leaves in rax. On AArch64, the analogous registers are x0/w0. An unoptimized x86-64 function may begin with push rbp; mov rbp, rsp and end with pop rbp; ret, because the compiler kept a frame pointer. Optimized leaf functions often have no visible frame: if they need no stack storage and call no other function, the whole function may be a few instructions followed by ret.
Consider a tiny function:
int scale(int x)
{
    return x * 10 + 3;
}
At -O0, you may see the argument copied from edi to a stack slot, loaded back, multiplied, added to, and returned. That is not the machine's preferred way to compute it; it preserves a close correspondence to source variables. At -O2, the same function commonly becomes register-only code. The compiler may form x * 5 with lea eax, [rdi+rdi*4], then x * 10 + 3 with lea eax, [rax+rax+3], and then ret. There is no source variable named eax; it is where the compiler placed the result. There is no load because the argument is already in a register. There is no store because no addressed object had to live in memory.
That is the first rule of reading assembly from C: loads and stores are evidence. A mov from [rdi] reads memory pointed to by the first argument. A mov to [rsi+8] writes near the second argument. Register-to-register moves, lea, add, shl, imul, and vector instructions operate on values already inside the core. In a per-packet hot path, code that keeps header fields, counters, and bounds in registers differs sharply from code spilling them to the stack.
The optimizer is a collection of semantics-preserving rewrites. Inlining replaces a call with the called function's body, exposing constants and eliminating call overhead. Constant folding evaluates compile-time expressions such as 1500 + 14; constant propagation carries known values forward so branches or arithmetic can simplify. Dead-code elimination removes computations whose results cannot affect observable behavior. Common-subexpression elimination reuses one result when two expressions compute the same value. Loop-invariant code motion hoists work out of a loop when it computes the same value every time. Register allocation maps compiler temporaries onto architectural registers, spilling only when needed.
Strength reduction replaces an expensive operation with a cheaper equivalent. Multiplication by a power of two may become shl; multiplication by a small constant may become lea or shifts and adds. Division is especially revealing. For unsigned x / 10 with a compile-time divisor, optimized x86-64 code often does not contain div. It may multiply by a precomputed reciprocal-like "magic" constant, keep the high half of the product, shift, and adjust. The mathematics is exact for the integer width and rounding rule. This is why an instruction listing can contain a bizarre imul constant where the C said divide.
Loop vectorization is the same idea at a wider scale. A scalar loop such as:
void add(int *dst, const int *a, const int *b, int n)
{
    for (int i = 0; i < n; i++)
        dst[i] = a[i] + b[i];
}
may compile into a loop that handles several int elements per iteration using xmm or ymm registers on x86, or NEON registers on AArch64, followed by cleanup code for the remaining elements. When reading that disassembly, do not look for one source iteration. Look for the vector loop, pointer increments, controlling branch, and scalar tail. If the compiler could not prove enough about overlap, alignment, or trip count, the generated code may contain runtime checks or may remain scalar.
The reason optimized assembly often looks unlike the C is the as-if rule: the implementation may perform any transformation that preserves observable behavior. C describes an abstract machine. The executable targets a real one with pipelines, reorder buffers, branch predictors, load/store queues, and SIMD units. Within the language rules and ABI, and with extra latitude when undefined behavior is present, the compiler's job is not to preserve your spelling; it is to produce the same required effects.
To inspect what happened, use the form that answers the question in front of you. gcc -O2 -S file.c or clang -O2 -S file.c shows compiler-produced assembly. objdump -d binary shows the instructions in the generated binary. Matt Godbolt's Compiler Explorer at godbolt.org keeps source and assembly side by side and makes target changes cheap. When matching source to instructions, compile a small function, keep irrelevant code out of the view, and read values through registers and memory references rather than through source variable names.
This closes the loop from C to the machinery beneath it. The optimizer reshapes code because the processor rewards steady pipelines, predictable control flow, register-resident data, and wide operations; the disassembly is where those choices become visible.
Sources