🐧 The Operating System & Kernel
What the OS does beneath your program: processes and threads, syscalls, scheduling, memory management, interrupts, drivers, the network stack, and observability.
4.1 What the kernel does for you
An operating system kernel exists because a real machine is too dangerous, too irregular, and too shared to hand directly to ordinary programs. The CPU can execute privileged instructions, the MMU can decide which virtual addresses mean which physical pages, devices can DMA into memory, disks and NICs can raise interrupts, and multiple programs all want CPU time at once. The kernel is the body of code trusted to control those mechanisms and turn them into a coherent programming environment.
Resource manager. The kernel decides who gets scarce machine resources and under what rules. It schedules runnable threads onto CPUs, allocates and revokes physical memory, accounts for file descriptors and sockets, arbitrates access to storage and network devices, and handles time as a shared resource rather than a private illusion. A user process may ask to read(), mmap(), send a packet, or create a thread, but the kernel decides whether the request is valid, how it maps onto hardware state, and what other work must be preserved while it happens.
Hardware abstraction. The kernel also hides enough of the machine that most code can run without knowing the exact interrupt controller, block device, page-table format, or NIC register layout. That abstraction is not magic; it is implemented by device drivers, architecture-specific entry code, memory-management code, and subsystem policy. Linux is monolithic in the architectural sense: core kernel code and most drivers run in one privileged kernel address space, even though many drivers can be built as loadable modules. For low-level networking work, this distinction is practical rather than academic: a NIC driver is normally kernel code, and a packet path may cross from hardware DMA rings, through driver and network-stack code, into a user buffer or socket API.
The user/kernel split is the protection boundary that makes this arrangement survivable. On x86-64 systems, ordinary application code normally runs at the least-privileged level, ring 3, while the kernel runs at the most-privileged level, ring 0. Page tables mark mappings as user-accessible or supervisor-only, and the MMU enforces that distinction on memory references. A process can corrupt its own address space; it should not be able to overwrite the scheduler, another process, or a NIC descriptor ring owned by the kernel.
The price of that protection is explicit mediation. Entering the kernel through a system call, taking an interrupt, blocking in the scheduler, faulting in a page, or receiving a packet all involve controlled transitions between user execution, kernel execution, and hardware state. The rest of the chapter opens those transitions up: processes and address spaces, system-call entry, scheduling, memory management, interrupts, drivers, the Linux network stack, time, and the tracing tools used when the abstraction leaks.
Sources
4.2 Processes, threads, and address spaces
A process is the operating system's abstraction of a running program: an isolated container for execution. It bundles a private virtual address space, open resources such as file descriptors, credentials, and at least one thread of execution. The important word is isolated. If two programs both use virtual address 0x400000, they are not fighting over the same byte of DRAM, so one process cannot accidentally store through a wild pointer into another process's heap.
Linux builds this abstraction out of smaller kernel objects. Every schedulable entity is represented by a struct task_struct, defined in include/linux/sched.h. The user address space is a separate struct mm_struct, reached through the task's mm pointer. Open file descriptors live in a file-descriptor table. Credentials, signal handling, filesystem context, and namespaces are also separate objects. A Unix "process" is therefore a composition of refcounted pieces, with one or more tasks pointing at them.
That composition is what makes threads natural rather than magical. A thread is another execution stream in the same process: same code mappings, globals, heap, shared memory mappings, and generally the same open file-descriptor table. On Linux, multiple task_structs can point at the same mm_struct. They may be in different functions, but their loads and stores go through the same virtual address space.
Each thread still needs private execution state. It has its own user stack, kernel stack, saved CPU register context, and kernel thread ID. The register context includes the program counter, stack pointer, and general-purpose registers: the state needed to stop and later resume execution. Linux exposes the kernel thread ID through gettid(). In a single-threaded process, the TID and PID are the same; in a multithreaded process, all threads have the same process ID from getpid(), but distinct TIDs.
Shared memory is why threads are fast to communicate and why threaded C is dangerous. Passing work can be as cheap as writing a descriptor into a ring buffer and updating an index. The same fact means unsynchronized writes can tear invariants apart. A high-performance packet engine often runs one thread per core, all in one address space, sharing rings, flow tables, and statistics. The central design question is which state is per-thread and which is shared. The Concurrency chapter returns to locks, atomics, memory ordering, and ownership.
Linux unifies processes and threads through clone(2). At the kernel level, both are tasks; the difference is which resources the new task shares. CLONE_VM shares the address space. CLONE_FILES shares the file-descriptor table. CLONE_FS shares filesystem context such as root, current working directory, and umask. CLONE_SIGHAND shares signal-handler dispositions. CLONE_THREAD places the new task in the same thread group: one process ID from getpid(), distinct TIDs. POSIX threads, or pthreads, are the standard userspace API; on modern Linux/glibc, NPTL maps them 1:1 onto kernel tasks.
By contrast, fork(2) creates a new process that shares almost nothing at the process-abstraction level. The child gets its own task, address-space object, file-descriptor table, and copied process state. The memory copy is not eager. Linux uses copy-on-write pages: parent and child map the same physical pages read-only, and copying is deferred until one side writes. That is why fork() can be cheap even with a large heap.
The return value of fork() is the classic split in control flow: zero in the child, the child's PID in the parent, and -1 on failure.
pid_t pid = fork();
if (pid == 0) {
    char *argv[] = { "echo", "ready", NULL };
    execvp(argv[0], argv);
    _exit(127);
}
execve(2) is the other half of the Unix process-creation idiom. It does not create a new process. It replaces the current process image: old text, data, heap, and stack are torn down, and a new program is loaded with new arguments and environment. The PID remains the same. Open file descriptors remain open by default across execve(2), unless marked close-on-exec with FD_CLOEXEC or created with O_CLOEXEC.
This split gives the child a precise window between fork() and execve(). A shell can fork, then in the child wire up standard input and output with dup2(), close unwanted descriptors, adjust environment or credentials, and exec the target. The parent keeps its own image and can wait, pipeline, or continue accepting commands.
A task's context is saved CPU state plus the kernel bookkeeping needed to run it: registers, stack pointers, scheduling state, address-space pointer, credentials, file tables, and so on. A context switch saves one task's register state and restores another's. Switching between two threads in the same process is usually cheaper than switching between unrelated processes because the address space does not change: the page-table root and much TLB-relevant state can remain valid. How the CPU enters the kernel belongs to the next section; how the kernel chooses a runnable task belongs to Scheduling.
Once you internalize that a Linux thread is a task sharing an mm_struct, ps -T, top in thread view, and /proc/<pid>/task become less mysterious: they show the schedulable tasks inside what userspace calls one process.
Sources
4.3 System calls and mode switches
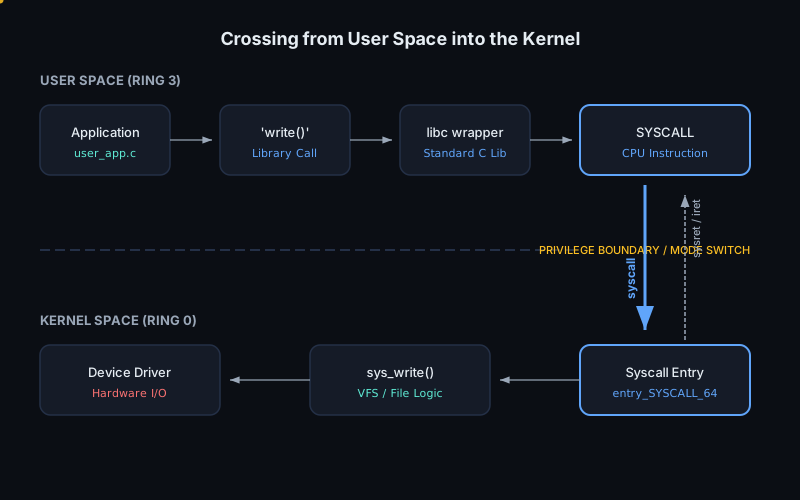
User code cannot simply call a kernel function. A normal call instruction only changes the instruction pointer within the current privilege level; it does not grant permission to execute privileged instructions or touch kernel mappings. A system call is the controlled doorway through that boundary: the program asks for one specific kernel service using a CPU-defined entry instruction whose target was installed by the kernel.
On x86-64 Linux, the normal 64-bit path uses the syscall instruction. Older interfaces exist: int 0x80 was the classic software-interrupt interface, and sysenter/sysexit was an intermediate fast path used mainly for 32-bit code. This is not a hardware device interrupt. It is synchronous and deliberate: the thread executes an instruction, enters the kernel immediately, and later resumes as the same thread unless the kernel blocks, delivers a signal, or schedules something else.
The user-kernel contract has its own ABI. It is similar to the ordinary System V AMD64 C calling convention, but not identical. The system call number goes in rax. Up to six arguments go in rdi, rsi, rdx, r10, r8, and r9. The return value comes back in rax. The fourth argument uses r10, not rcx, because the syscall instruction itself uses rcx to save the user return address and uses r11 to save the user RFLAGS; both registers are therefore clobbered by the transition.
Conceptually, a three-argument system call looks like this:
rax = SYS_write;   /* syscall number */
rdi = fd;          /* arg0 */
rsi = buf;         /* arg1 */
rdx = len;         /* arg2 */
syscall;
The hardware part is intentionally narrow. In long mode, syscall saves the address of the next user instruction into rcx, saves flags into r11, masks selected flags, changes privilege from ring 3 to ring 0, and loads the kernel entry address from the LSTAR model-specific register. The instruction does not perform the whole system call; it only reaches the kernel's common entry code. From there Linux builds the kernel-side frame, checks the system call number, dispatches to the implementation, copies data to or from user memory where needed, and prepares a return path. If the fast return conditions are satisfied, sysret returns to user mode.
That boundary crossing is cheap compared with disk or network I/O, but expensive compared with an ordinary function call. A bare syscall/sysret round trip is often in the low hundreds of cycles, or roughly hundreds of nanoseconds on contemporary CPUs. Real system calls cost more because the entry path touches kernel code and data, can disturb branch predictors and caches, validates user pointers, and may copy memory. Security mitigations matter too. Kernel Page Table Isolation, introduced for Meltdown-class attacks on affected CPUs, can add page-table switching and TLB pressure; PCID and later kernel work reduce but do not erase that cost. Measure on the target CPU, kernel, microcode, and mitigation settings. Treat "one syscall" as small but not free.
This is why low-level I/O code cares about syscall rate. A single read, write, send, recv, accept, epoll_wait, or ioctl is a transition through this doorway. If a packet-processing loop performs one syscall per packet, the fixed cost enters the per-packet budget before the NIC, driver, protocol stack, or application has done useful work. Batching, readiness APIs, shared rings, and later kernel-bypass designs start from the same observation: crossing the boundary less often is better than crossing it for every tiny unit of work.
There is one important wrinkle: not every C library function that looks like a system call traps into the kernel. Linux maps a small shared object, the vDSO, into each process. For operations where the kernel can safely publish read-mostly data to user space, libc can call vDSO code as an ordinary function. Time queries such as clock_gettime and gettimeofday are common examples on systems and clock modes that support it. The kernel still controls the data and ABI, but the fast path avoids the privilege transition. If the vDSO cannot answer, it can fall back to a real system call.
Most C programs do not issue raw syscall instructions directly. They call libc wrappers such as read, write, mmap, or close. In glibc, musl, and similar C libraries, these wrappers place the system call number and arguments in the required registers, execute the architecture's system call instruction or vDSO path, and normalize the result into the C/POSIX interface. Linux system calls conventionally return either a nonnegative result or a negative error code in rax, usually -4095 to -1. The libc wrapper turns that into -1 and stores the positive error number in thread-local errno.
The raw syscall(2) function is available:
#include <sys/syscall.h>
#include <unistd.h>

long n = syscall(SYS_write, fd, buf, len);
It is useful for new or uncommon system calls before a named libc wrapper exists, but it is not a nicer interface. It exposes the architecture-specific convention, bypasses some libc policy, and still performs the same privilege transition unless the operation uses a wrapper-specific vDSO fast path. For everyday C, the wrapper is the right abstraction; for systems work, knowing what it wraps explains the semantics and latency profile.
Sources
4.4 Scheduling
Preemptive multitasking exists because a runnable program cannot be trusted to yield the processor at the right time. In a cooperative system, one loop can make the machine feel dead. In a preemptive system, the kernel retains control: when scheduling is needed, commonly because a timer tick has expired or because a task blocks, wakes, exits, or changes priority, the scheduler chooses which runnable task should execute next on that CPU.
The old teaching model is the time slice, or quantum: give task A a bounded interval, then give task B a bounded interval, and so on. That model is still useful, especially for SCHED_RR, but Linux's normal scheduler is not simply round-robin. The deeper goal is fairness: over a meaningful interval, runnable tasks of the same priority should receive comparable CPU service, while higher-weight tasks receive proportionally more.
Linux's classic fair scheduler was CFS, the Completely Fair Scheduler, merged in Linux 2.6.23. CFS modelled an ideal processor that could run all runnable tasks at once, each at its fair CPU fraction. Real hardware can run only one task per hardware thread, so CFS tracked progress in this ideal world using vruntime, a weighted virtual runtime. A task that consumed CPU accumulated vruntime; a task that slept did not. The run queue was kept ordered by vruntime in a red-black tree, and CFS picked the leftmost task: the runnable entity that had received the least weighted service.
As of Linux 6.6, released on 29 October 2023, the default fair scheduler became EEVDF, Earliest Eligible Virtual Deadline First. EEVDF keeps the fair-share idea but makes latency more explicit. It tracks whether a task is owed CPU time using lag, considers only eligible tasks, and chooses the eligible task with the earliest virtual deadline. The point is not to abandon fairness for throughput; it is to decide which fair task should run soonest when wakeups, sleepers, and latency-sensitive tasks interact.
For normal work, priority is usually expressed through nice. Linux nice values run from -20 to +19: lower nice means higher weight and therefore a larger CPU share; 0 is the usual default. Interfaces include nice, renice, setpriority, and the scheduler syscalls. Linux exposes normal policies such as SCHED_OTHER or SCHED_NORMAL, plus SCHED_BATCH for CPU-bound batch work and SCHED_IDLE for work that should run only when the machine is otherwise idle.
Real-time scheduling is different. SCHED_FIFO and SCHED_RR are fixed-priority policies with priorities from 1 to 99, where larger numbers are more urgent. A runnable real-time task outranks normal fair-scheduled tasks. SCHED_FIFO runs until it blocks, yields, is preempted by a higher-priority real-time task, or is forced off CPU; SCHED_RR adds a round-robin quantum among tasks at the same priority. SCHED_DEADLINE uses an earliest-deadline-first model with runtime, deadline, and period parameters. These classes are powerful and dangerous: a CPU-bound SCHED_FIFO thread at high priority can starve ordinary system work. Linux therefore has mechanisms such as real-time bandwidth throttling, and production systems still require careful design rather than simply "make it RT".
The main API for changing a thread's scheduling policy is sched_setscheduler; chrt is the common command-line tool. A tiny sketch of CPU pinning looks like this:
CPU_ZERO(&set);
CPU_SET(6, &set);
sched_setaffinity(0, sizeof set, &set);
CPU affinity says where a task may run. sched_setaffinity sets a thread's CPU mask; taskset is the common command-line tool. Affinity matters because migration is not free. A moved thread loses warm private caches, may move away from the NUMA node holding its data, and may disturb other cache residency. For a NIC receive path, pinning an RX thread near the PCIe-attached NUMA node can matter as much as the poll-loop code. Affinity is also constrained by cpusets: a task cannot escape the CPUs allowed by its cpuset or cgroup placement.
Low-latency networking often goes further than affinity. A kernel-bypass or accelerated networking thread, such as a DPDK or Onload-style busy-poll loop, may spin on an RX ring and rely on deterministic ownership of a core. For that use case, the goal is not merely "prefer CPU 6"; it is "keep almost everything else off CPU 6". Boot parameters and kernel facilities help: isolcpus can remove CPUs from general scheduler load balancing, nohz_full can suppress the regular scheduler tick when a single runnable task owns the CPU, and rcu_nocbs can offload RCU callbacks away from selected CPUs. Cpusets or cgroups then keep ordinary processes elsewhere.
Isolation is incomplete unless interrupts are handled too. NIC queues, storage devices, and timer-related work can still interrupt an isolated core unless IRQ affinity is configured. In a low-latency packet path, steer the NIC queue to the intended CPU or move unrelated IRQs away, pin the poll thread, allocate memory on the local NUMA node, and keep housekeeping work on separate cores. The scheduler is then mostly absent from the data path: the fastest scheduling decision for a dedicated polling core is often no scheduling decision at all.
Sources
4.5 Memory management in the OS
The kernel does not normally allocate a physical page for every byte of virtual address space it promises to a process. It first records ranges as VMAs: readable here, writable there, file-backed here, anonymous there, private or shared. Demand paging means the mapping exists before the RAM does. Physical pages are supplied later, when the program first touches an address and the page-fault handler makes the mapping real.
For an address that belongs to a valid VMA, a page fault is often ordinary kernel work, not a bug. If the page is already resident, the kernel can install the mapping without storage I/O: a minor fault. That covers a file page already in the page cache, or a fresh anonymous read served from the shared read-only zero page. On the first write, the kernel allocates a real page and copies away from zero. If data must be fetched from backing store, such as a file page missing from RAM or an anonymous page swapped out, the fault is a major fault because it requires I/O. In a low-latency receive path, a major fault is catastrophic jitter.
Copy-on-write is the same policy in another form. After fork(), parent and child can share pages read-only until one writes. With a MAP_PRIVATE file mapping, the file supplies the initial bytes, but writes go to private anonymous copies rather than back to the file.
mmap() adds a mapping to the process address space. With a file descriptor, it maps file bytes at an offset. With MAP_ANONYMOUS, it creates zero-filled memory not backed by any file; large allocator requests often reach the kernel this way. The sharing flags define write visibility:
MAP_PRIVATE: copy-on-write; writes are private and are not carried through to the underlying file.MAP_SHARED: writes are visible to other mappings of the same region and, for file-backed mappings, are carried through to the file under normal writeback rules.
The call still means "install this VMA", not "fault every page now". Pages arrive lazily. munmap() removes the mapping, so later references to that range are invalid. Latency-sensitive programs often prefault during initialization with page touches or MAP_POPULATE, then pin resident pages with mlock() or mlockall(MCL_CURRENT | MCL_FUTURE).
madvise() is the softer interface: MADV_DONTNEED says the range is no longer needed, while MADV_HUGEPAGE asks Linux to consider it for Transparent Huge Pages. These calls influence policy; they do not repeal demand paging.
The page cache is the kernel's RAM cache of file contents, keyed by file and offset. read() copies from it into a user buffer, reading storage into the cache first on a miss. write() copies from the user buffer into cached file pages, marks them dirty, and lets writeback push them to storage later. A file mmap() avoids that extra user-buffer copy after the fault: the process maps cached file pages directly.
This is why "free memory" on Linux is a poor performance model. RAM not needed for anonymous working sets or kernel data is useful as page cache, and clean cache pages are reclaimable: the kernel can drop them and reread the file later. Dirty file-backed pages must be written back before reuse. Durability is a separate promise: fsync() asks the kernel to force dirty file data and required metadata to stable storage rather than relying on background writeback. vm.dirty_background_ratio starts background flushing; vm.dirty_ratio is the higher threshold where writers can be forced to help or wait.
Under memory pressure, Linux reclaims pages. Clean file-backed pages are cheapest because their home copy already exists. Dirty file-backed pages need writeback. Anonymous pages have no file home, so eviction requires swap: a swap partition or swap file. Reclaim uses active and inactive LRU-style lists. A low watermark wakes kswapd to scan asynchronously; at the minimum watermark, the allocating task can enter direct reclaim and stall. vm.swappiness biases reclaim between file cache and anonymous memory; the documented default is 60. If reclaim cannot keep up, the OOM killer is the last resort.
Pinned memory is the counterweight to reclaim. mlock() and mlockall() keep pages resident, which matters for real-time and packet-processing code, but pinned pages reduce the memory the kernel can manage for everyone else. Use them where a fault or swap-in would violate the latency contract.
On x86-64 Linux, ordinary pages are typically 4 KiB; huge pages are commonly 2 MiB and 1 GiB. The hardware chapter owns the TLB details, but the OS consequence is simple: larger pages let large working sets use fewer page-table objects and TLB entries.
Linux has two main huge-page mechanisms. HugeTLB is explicit: reserve a pool with interfaces such as nr_hugepages, then map it through hugetlbfs or MAP_HUGETLB. These pages are predictable and outside normal reclaim, but they are operationally manual. Transparent Huge Pages are automatic: the kernel may allocate or collapse suitable memory into huge pages, controlled by modes such as always, madvise, and never, with khugepaged doing background collapse. THP is convenient, but allocation, compaction, and collapse can create latency spikes; latency-sensitive systems and many databases often disable THP globally or use madvise mode, then reserve explicit HugeTLB pages where they really need them.
Sources
4.6 Interrupt handling in the kernel
An interrupt is the device's way of forcing the kernel to stop treating the current thread as the whole story. A process may have been running, or the kernel may have been inside a system call, but the interrupt path is not ordinary process execution. The low-level entry code reaches the generic IRQ layer, which finds the irq_desc, runs the interrupt flow handler, and calls the driver handler registered with request_irq.
That first driver handler is the hard IRQ handler, often called the top half. It runs in hardirq context: in_hardirq() is true, there is no useful process context, and the handler must obey atomic-context rules. It cannot take a mutex, wait for I/O, allocate memory with sleeping flags, copy to user space, or call anything that depends on scheduling the current task away. Code that shares data with IRQ context often uses primitives such as local_irq_disable() or spin_lock_irqsave(), but the goal is to need very little of that machinery in the hot path.
Handlers must be short for a system-wide reason. While a CPU is in hardirq context, it is delaying the interrupted work and may be delaying other interrupt work on that CPU. A slow handler pushes out timers, scheduler progress, device service, and latency-sensitive packet paths. A NIC driver, for example, should acknowledge or mask the device quickly, record enough state, arrange later work, and return. Walking large descriptor batches, allocating freely, or doing protocol work directly in the hard IRQ path turns line rate into interrupt latency.
Linux therefore splits interrupt handling into top halves and bottom halves. The top half runs immediately because the device needs a prompt response. The bottom half runs later because the remaining work is less urgent, more expensive, or easier to synchronize outside the strict hardirq path.
The classic bottom-half mechanism is the softirq. A softirq is a statically defined software interrupt vector raised by kernel code, commonly from a hard IRQ handler. Pending softirqs are normally run on return from interrupt or at similar kernel exit points. They still run in interrupt context, so in_softirq() is true and they still cannot sleep. Timers, RCU, block I/O, and networking all use this per-CPU machinery. If softirq load becomes too heavy, Linux can push the backlog to the per-CPU ksoftirqd kernel thread, allowing the scheduler to account for and preempt that work instead of letting interrupt-return processing monopolize the CPU.
Tasklets are a higher-level interface built on softirqs. They were historically convenient for drivers because a tasklet is dynamically registered and serialized against itself: one instance of a given tasklet will not run concurrently on two CPUs, although different tasklets can. The cost is the same atomic-context rule as softirqs. A tasklet function must be short, must not sleep, and must protect shared state against hard IRQs and other bottom halves. Tasklets are increasingly legacy, but the concept remains useful: do the minimum in the hardware interrupt, then run bounded deferred work.
Workqueues defer work further, into normal kernel worker threads. A normal workqueue item has process context and may sleep, so it is suitable for mutexes, memory reclaim, firmware operations, slow bus transactions, or calls into subsystems that may block. The tradeoff is latency and scheduling overhead. Use a workqueue when blocking is required or the work is not part of the immediate interrupt-latency budget. Network drivers often use hard IRQs only to move the device into a polling regime; NAPI builds on these ideas, but the packet journey belongs to the network-stack discussion.
Threaded IRQs give drivers another way to express the split. With request_threaded_irq, the driver supplies a primary hardirq handler and a thread_fn. The primary handler still runs in hardirq context. It checks whether the interrupt belongs to this device, performs the minimal acknowledgement or masking needed, and returns IRQ_WAKE_THREAD. The threaded handler runs in a dedicated kernel thread for that IRQ, conventionally visible as an irq/%d-%s thread, so it can use many blocking kernel APIs.
ret = request_threaded_irq(irq, my_irq, my_irq_thread,
                           IRQF_ONESHOT, "mydev", dev);
IRQF_ONESHOT matters when the interrupt source must not re-enter before the thread has dealt with it. The flag keeps the interrupt line masked until the threaded handler completes. Without it, a level-triggered device or a still-asserted status bit could retrigger immediately and race the thread. The model is not "threads instead of interrupts"; it is hardirq-then-thread, with the hard part small enough to preserve latency and the thread part large enough to perform the real device work safely.
Good interrupt code is shaped by context. In hardirq and softirq context, assume no sleeping, little stack, no user memory access, and pressure to finish. In workqueue and threaded-IRQ context, assume higher latency but blocking is possible. A driver that gets this boundary right is easier to lock under load. A driver that gets it wrong may pass idle tests and fail where low-level systems code is judged: high interrupt rate, shared CPUs, full queues, and latency-sensitive traffic.
Sources
4.7 Device drivers and the driver model
A device driver is kernel-resident code that makes one piece, or one family, of hardware look like a normal kernel object. The hardware might be a UART, an NVMe controller, or a Solarflare/AMD Ethernet NIC. The driver translates generic kernel and userspace requests into device-specific register writes, queue operations, firmware commands, interrupt handling, and DMA setup. The point is not merely to "talk to hardware"; it is to hide the exact chip behind a uniform interface so filesystems, sockets, block I/O, and applications do not need to know which vendor's device is underneath.
Linux organizes this with the driver model. At the core are struct device, struct bus_type, and struct device_driver, all integrated with struct kobject. A kobject gives kernel objects names, reference counts, hierarchy, and usually a sysfs representation. That is why devices and drivers are visible under /sys/devices, /sys/bus, and /sys/class: sysfs is a view of kernel object relationships.
The model is a three-way relationship. A bus is an enumeration and matching domain: PCI, USB, platform, SPI, I2C, and so on. In Linux this is a struct bus_type. A device is one discovered instance, represented by struct device and often embedded in a bus-specific object such as struct pci_dev. A driver is code that can manage devices on that bus, represented by struct device_driver and usually wrapped by something bus-specific such as struct pci_driver.
Binding connects one device instance to one driver. The kernel tries it in both directions: a new device is compared with registered drivers, and a new driver with unclaimed devices. The bus supplies the comparison rule through .match; for PCI, that means comparing vendor/device/class identity against the driver's ID table. MODULE_DEVICE_TABLE(pci, ids) exposes entries such as struct pci_device_id so userspace can load the right module from a modalias uevent.
If .match says yes, the driver core calls .probe(). Probe is where a matched device becomes usable kernel state: the driver claims resources, maps registers, initializes private state, requests its IRQ, prepares rings or queues, and registers with the right subsystem. For a NIC, a PCI driver's probe commonly allocates and registers a struct net_device; storage registers block queues and disks; serial-like hardware may register a character device.
static int my_probe(struct pci_dev *pdev,
                    const struct pci_device_id *id)
{
        /* claim resources, initialize hardware, register subsystem object */
        return 0;
}
The inverse path is .remove(): stop new I/O, unregister the subsystem object, quiesce hardware, free IRQs, unmap registers, release resources, and drop references.
Binding is visible and controllable through sysfs. A bound PCI device appears under /sys/devices/... and through links such as /sys/bus/pci/devices/0000:03:00.0. Drivers appear under /sys/bus/pci/drivers/<driver>/, and many buses expose bind and unbind files there. Writing a device name to /sys/bus/<bus>/drivers/<drv>/unbind detaches it; writing it to another driver's bind attaches it if matching and policy allow. This is the same model used when a NIC moves to a userspace-oriented driver, revisited with VFIO/UIO and DMA mechanics in chapter 5.
The driver model says how devices and drivers find each other. The device class says what interface the rest of the kernel and userspace see after probe succeeds. The classic categories are character, block, and network devices, but they are not interchangeable.
Character devices expose byte-oriented operations and device-specific controls. Userspace usually sees a /dev node with a major/minor number; opening it reaches a struct file_operations table. A driver may initialize a struct cdev with cdev_init(), add it with cdev_add(), and create the node via class/device machinery. Older or simpler code may use register_chrdev().
static const struct file_operations my_fops = {
        .owner          = THIS_MODULE,
        .open           = my_open,
        .read           = my_read,
        .unlocked_ioctl = my_ioctl,
        .mmap           = my_mmap,
};
Character devices fit streams, control endpoints, debug interfaces, or devices whose operations are not naturally block I/O or packets.
Block devices expose random-access storage in fixed-size sectors or logical blocks. They also have /dev nodes, such as /dev/nvme0n1 or /dev/sda, but I/O flows through the block layer, which merges, schedules, accounts, partitions, and submits requests. Filesystems sit above this interface; the driver implements lower queueing and completion for storage commands.
Network devices are different. There is no /dev/eth0 that applications read() and write() for normal packet I/O. A NIC driver registers a struct net_device, which appears as eth0, ens5f0, or similar under /sys/class/net and tools like ip link. Applications use sockets; the network stack routes work through the registered interface. Driver hooks live in struct net_device_ops, with methods like ndo_open and ndo_start_xmit. That is the class a Solarflare/AMD NIC driver implements: mechanically it may be a PCI driver, but semantically its probe creates a network interface for the socket and packet layers above it.
This separation is the important interview-level idea. The bus model answers, "which driver owns this physical device?" Probe answers, "how does ownership become initialized kernel state?" The class interface answers, "how does the rest of the OS use it?"
Sources
4.8 The Linux network stack
The network stack is where interrupts, DMA rings, kernel allocation, queues, and sleeping tasks meet. Linux avoids treating every protocol boundary as a copy boundary by carrying packets in struct sk_buff, usually called an skb. One skb can move up from a NIC to a socket, or down from a socket to a NIC, while each layer adjusts metadata and byte pointers.
An skb is mostly metadata. Packet bytes live in an associated buffer described by head, data, tail, and end. head points at the allocated buffer. data points at the first byte currently visible to this layer. tail points just past the visible bytes. end bounds the allocation. Space before data is headroom; space after tail is tailroom.
That geometry explains the classic helpers. skb_reserve() creates headroom. skb_put() appends bytes at the tail. skb_push() moves data backward for a lower-layer header. skb_pull() moves data forward after a layer consumes a header. Headers are therefore often added or removed by pointer movement, not copying. struct skb_shared_info can also describe page fragments and a frag_list, letting the stack represent paged payload, clones, GRO, and GSO without flattening everything into one linear buffer.
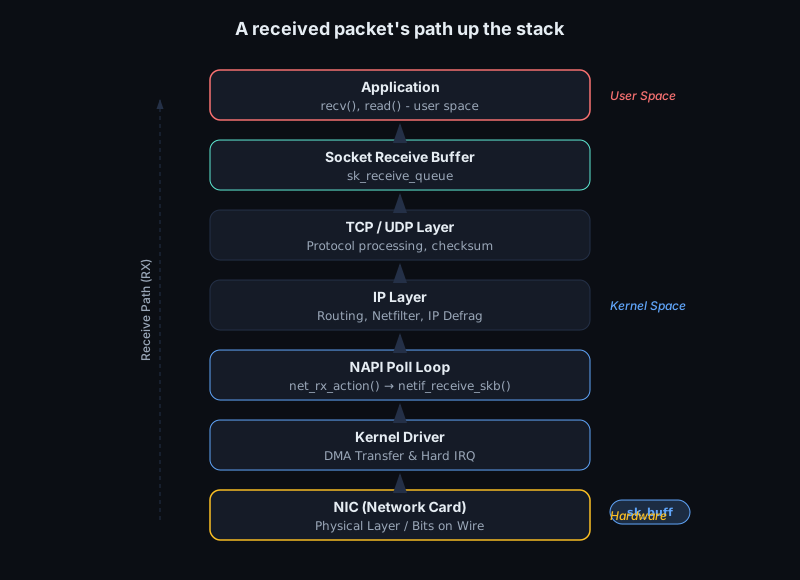
On receive, the NIC first DMAs frames into buffers named by descriptors in an RX ring. When work arrives, the device raises an interrupt. The driver's hard IRQ path should do little: acknowledge or mask the device as needed, then call napi_schedule() for the queue's struct napi_struct. Packet harvesting runs later from NET_RX_SOFTIRQ context.
NAPI is the hybrid interrupt-then-poll mechanism. The first event gets interrupt latency; the following burst is drained by polling. While scheduled, the driver's poll method is called with a budget. It walks completed RX descriptors, builds or attaches skbs, records metadata such as checksum status, replenishes the RX ring, and passes packets upward with napi_gro_receive() or netif_receive_skb(). If work remains when the budget is exhausted, NAPI stays scheduled. If the ring drains, the driver completes the NAPI cycle and re-enables the device interrupt.
The point is control under load. A packet stream that would otherwise cause one interrupt per packet becomes one interrupt followed by bounded batches of softirq work. The per-poll budget prevents one busy device from monopolizing a CPU, and system knobs such as net.core.netdev_budget and net.core.netdev_budget_usecs bound one NAPI polling cycle across devices.
After an skb enters the generic receive path, the stack dispatches by registered packet type. Ethernet demultiplexing finds a struct packet_type; IPv4 frames, for example, enter handlers such as ip_rcv(). From there, IP validation, routing, netfilter hooks, and transport demultiplexing eventually identify a struct sock. The transport layer enqueues data-bearing skbs, or data copied from them, into the socket receive side and wakes tasks blocked in receive or readiness waits. The protocol rules are later material; the kernel plumbing is RX ring, skb, protocol dispatch, socket buffer, wakeup.
Transmit is the mirror image with an extra policy layer. A task writes to a socket. The protocol stack creates skbs, accounts them to the socket send buffer, and prepends headers as the skb moves downward. Before the driver sees the packet, normal device transmit passes through the queueing discipline, or qdisc, attached to the device. A qdisc is the kernel's transmit scheduler: it may be the automatic pfifo_fast default when no policy is configured, fq, fq_codel, or mq on multiqueue devices to fan out to per-TX-queue qdiscs. Qdiscs are not just FIFOs; unmanaged queues create latency under load. fq_codel is a direct response to bufferbloat: keep queues short, preserve fairness, and drop or mark before delay becomes pathological.
After qdisc dequeue, the core transmit path calls the driver's ndo_start_xmit method. The driver maps packet data for DMA if needed, writes a TX descriptor into the NIC's TX ring, and rings a doorbell register so the device notices new work. Later, TX completion tells the driver which descriptors have been consumed; the driver unmaps DMA and frees or consumes the skb, often from the same NAPI poll method that handles receive completions.
The socket layer is the backpressure boundary user code observes. A socket has send and receive buffers governed by net.core.wmem_default, net.core.rmem_default, net.core.wmem_max, net.core.rmem_max, and SO_SNDBUF / SO_RCVBUF. These are accounting limits over queued kernel objects and bytes, not flat arrays. If receive accounting fills, the stack must drop or apply protocol pressure. If send accounting fills, sendmsg() may block, fail with EAGAIN, or stop reporting writable readiness.
For NIC and driver work, the important shape is per-queue. Modern NICs have multiple RX and TX rings. RSS steers flows to RX queues, interrupts, and usually CPU-local NAPI contexts, keeping hot packet state local. The repeated costs are skb allocation and freeing, softirq dispatch, qdisc enqueue/dequeue, DMA mapping, and socket accounting. Those costs are exactly why later high-performance designs try to move hooks earlier, as XDP does before skb allocation, or bypass parts of the kernel stack entirely.
Sources
4.9 Time, timers, and clocks
Computers do not naturally know the time; they count events. A crystal oscillator, chipset timer, CPU counter, or NIC clock advances at some rate, and the kernel turns that count into seconds and nanoseconds. A clocksource is something the kernel can read to learn "where am I on the timeline?". A clock event device is something it can program to interrupt later. Reading time and scheduling future work are related, but they are not the same operation.
User space usually sees this through clock_gettime. CLOCK_REALTIME is wall-clock time: seconds and nanoseconds near UTC since the Unix epoch. It is the clock behind timestamps humans care about, logs, certificate validity, and file modification times. It is also settable. An administrator, NTP, a VM host, or time synchronization software can step it or slew it. It is affected by leap-second handling and by frequency corrections. That is wrong for elapsed time. If a benchmark starts just before CLOCK_REALTIME is stepped backward, the measured duration can become negative.
For elapsed intervals, use CLOCK_MONOTONIC:
struct timespec a, b;
clock_gettime(CLOCK_MONOTONIC, &a);
do_work();
clock_gettime(CLOCK_MONOTONIC, &b);
CLOCK_MONOTONIC cannot be set and will not jump because someone changed the time of day. On Linux it does not count time spent suspended, and it is still subject to gradual frequency adjustment by NTP and related mechanisms. That is usually what you want for latency measurement: it tracks elapsed real time without wall-clock discontinuities. CLOCK_MONOTONIC_RAW exposes a raw hardware-based monotonic clock not adjusted for frequency discipline; it is useful when studying the clock itself, but it may drift from real time. CLOCK_BOOTTIME is monotonic time plus suspend time. CLOCK_TAI is derived from wall-clock time but counts International Atomic Time rather than UTC leap-second behavior; it is relevant when comparing host time with PTP-disciplined hardware clocks.
On modern x86, the preferred clocksource is often the TSC, the Time Stamp Counter. RDTSC reads a 64-bit counter from the processor into EDX:EAX; RDTSCP also provides ordering semantics after earlier instructions and returns IA32_TSC_AUX, often used to encode CPU identity. Old TSCs were treacherous: if the counter advanced with core frequency, then P-states changed the rate; if different cores had unsynchronized counters, migrating a thread could make time appear to move oddly. Modern systems advertise constant or invariant TSC behavior, meaning the counter advances at a stable rate independent of normal frequency and power-state changes, and Linux will use it only when it trusts the platform. Otherwise it may choose HPET, acpi_pm, or a paravirtual clocksource in a VM.
You can inspect the kernel's choice through /sys/devices/system/clocksource/clocksource0/current_clocksource and /sys/devices/system/clocksource/clocksource0/available_clocksource.
The kernel rates and selects clocksources, then converts counter deltas into nanoseconds with fixed-point multiply/shift arithmetic. Fast time reads matter. A real system call costs hundreds of cycles, painful inside a busy-poll receive loop measuring per-packet latency. For supported clocks, Linux exposes a vDSO implementation of clock_gettime: kernel-provided code and data mapped into user space, so libc can compute the time without entering the kernel. If the active clocksource cannot be safely read from user mode, the fast path may not be available or may be slower. This is one reason a machine falling back from tsc to hpet can distort microbenchmarks.
Timers are the other half of the problem. The old model is the periodic tick: the kernel receives an interrupt CONFIG_HZ times per second and advances jiffies, where one jiffy is one tick. A HZ=250 kernel has a 4 ms tick. That is fine for many timeout paths in networking and storage, where a timer usually means "give up if nothing happens soon" and is normally canceled before it fires. It is not fine for precise sleeps or packet pacing at sub-millisecond intervals.
Linux high-resolution timers, hrtimer, avoid binding precision timers to jiffies. They store expiry times in nanosecond units, order timers by expiry, and program clock event hardware for the next deadline when high-resolution mode is available. This lets nanosleep, POSIX timers, and in-kernel precise events avoid tick granularity. It still does not mean "the callback runs exactly then": interrupt masking, softirq load, power management, and scheduler latency all add jitter. In a driver, a timer is a deadline request, not a real-time guarantee.
Network hardware adds another clock domain. With software timestamping, the timestamp is taken when a packet reaches some point in the kernel or driver path. With hardware timestamping, a capable NIC timestamps transmit or receive at the MAC/PHY boundary using its own PTP hardware clock, the PHC, often exposed as /dev/ptp0. SO_TIMESTAMPING can request software and hardware timestamps, returned separately. A PTP stack such as linuxptp can discipline the NIC clock, the system clock, or both, but you must know which clock produced each timestamp before subtracting values.
The practical rules are simple and unforgiving. Use CLOCK_MONOTONIC for elapsed wall-time intervals, CLOCK_MONOTONIC_RAW only when you deliberately want the undisciplined hardware timeline, and never use CLOCK_REALTIME for benchmark duration. Pin threads or record CPU identity when using RDTSC directly, serialize reads appropriately, and measure the measurement overhead. When comparing host and NIC timestamps, convert clock domains explicitly. Nanosecond numbers look precise even when the experiment is not.
Sources
4.10 Observability and tracing
The kernel is not a black box. It is a running program with data structures, counters, queues, locks, call paths, and timestamps; Linux gives you ways to observe those facts directly. The skill is choosing the right observation: read current state, count events, sample execution, or trace exact occurrences. Guessing that a NIC driver is “slow in the kernel” is not engineering. Seeing RX interrupt rates, NAPI poll time, cache misses, and CPU hot paths is engineering.
`/proc` and `/sys` are the first window. They are pseudo-filesystems: not ordinary disk-backed files, but kernel-provided file interfaces usually mounted as procfs at /proc and sysfs at /sys. Reading /proc/<pid>/status, /proc/<pid>/maps, /proc/interrupts, /proc/softirqs, /proc/net/dev, or /proc/sys/net/core/* asks the kernel to format current state as bytes. Some files are writable controls, including many sysctls under /proc/sys.
sysfs is more object-structured. It exposes the kernel device model: buses, devices, drivers, classes, and attributes. For driver work, paths such as /sys/bus/pci/devices/0000:03:00.0/, /sys/class/net/eth0/, /sys/class/net/eth0/statistics/rx_packets, and driver-specific attributes are often more useful than logs. Many files map to small show and store methods in a driver. Reading them is cheap: no daemon, capture, or disk seek, just a file read that calls kernel code to produce a small value.
`perf` answers a different question: what happened on the CPU, and where? The kernel interface underneath is perf_event_open(2), which creates file descriptors for performance events. Some events are software events, but the famous ones come from the processor PMU: cycles, retired instructions, cache references, cache misses, branch instructions, branch misses, stalled cycles, and architecture-specific events. perf stat counts. Running perf stat -e cycles,instructions,cache-misses,branch-misses ./workload gives totals and ratios: CPI, instruction rate, and miss rates.
perf record samples. The kernel interrupts execution at a configured event rate, records instruction pointers and call chains, and writes perf.data. perf report attributes samples to functions, objects, kernel symbols, and call stacks; the same data can be folded into flame-graph-style views. perf top is the live version: a top-like display of the hottest functions. On a networking system this can separate checksum cost, RX refill cost, time in net_rx_action, or user space dominating.
ftrace and tracepoints are for event order and kernel control flow. ftrace is the built-in kernel tracer, normally controlled through tracefs at /sys/kernel/tracing; on older or differently mounted systems the same interface is commonly found at /sys/kernel/debug/tracing. current_tracer selects tracers. The function tracer records kernel function entries. The function_graph tracer records call nesting and return durations: not only “which function ran?” but “who called it and how long did the call subtree take?”
Tracepoints are static instrumentation points compiled into meaningful places: scheduler switches, IRQ handling, block I/O, networking, syscalls, and subsystem-specific paths. When disabled, they are designed to be very cheap. When enabled, they write structured records into per-CPU trace buffers readable through trace, trace_pipe, and the events/ hierarchy. Scheduler, IRQ, or net tracepoints can show whether packet processing moved from hard IRQ to softirq, which CPU ran it, and whether scheduling latency interrupted the path. trace-cmd records and reports this data without hand-scripting tracefs.
kprobes and uprobes fill the gap where no static tracepoint exists. A kprobe dynamically instruments a kernel instruction or function; a uprobe does the same for user-space code. They let you ask a new question after the system is already built: how often is this driver function reached, with which arguments, and what does it return? They are sharper tools than tracepoints, because you are binding to implementation details that may change with compiler options or kernel versions.
eBPF, usually just called BPF in current kernel documentation, takes tracing one step further. It is an in-kernel, verified bytecode execution environment. Programs are loaded and managed through bpf(2), checked by the verifier, and attached to tracepoints, kprobes, uprobes, perf events, socket paths, TC, or XDP. For observability, the crucial idea is aggregation in kernel context. Instead of copying every packet event, function entry, or latency sample to user space, a BPF program can increment a map counter, build a histogram, remember timestamps, or emit only exceptional events.
The common front ends are BCC and bpftrace. BCC is a toolkit for building BPF-based tracing tools, often with Python or C-like BPF programs underneath. bpftrace is a higher-level language for one-liners and short scripts: count calls, histogram latencies, print arguments, sample stacks. Use /proc and /sys for state and counters; perf stat for counts; perf record and perf top for sampled attribution; ftrace and tracepoints for ordered kernel events; BPF when you need programmable, low-volume answers from high-volume activity.
The unifying property is low overhead when idle. Static tracepoints, ftrace call sites, PMU counters, and BPF hooks are engineered so an inactive question costs little enough to leave the machinery present. That is why they matter in driver and NIC work: failures often exist only under real interrupt rates, DMA pressure, cache behavior, and scheduling noise. Observability keeps the system real while making it explain itself.
Sources